WrITING TASK 1
You should spend about 20 minutes on this task.
Write about the following topic:
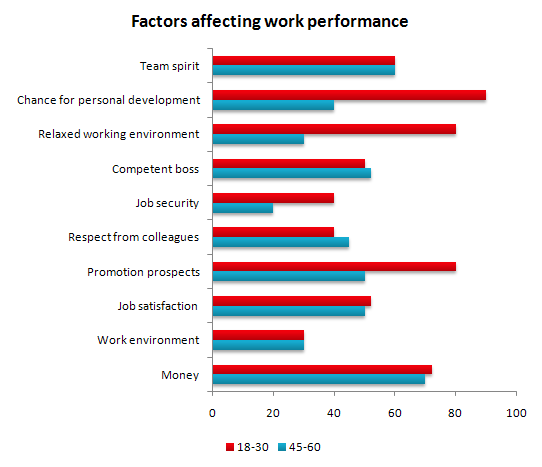
The bar chart below shows the results of a survey conducted by a personnel department at a major company. The survey was carried out on two groups of workers: those aged from 18-30 and those aged 45-60, and shows factors affecting their work performance.
Write a report for a university lecturer describing the information shown below.
Write at least 150 words.